Listen to this article
Have you ever worked with financial data trapped in Excel files? After facing these challenges in my professional roles at MediaMarktSaturn and Flix SE, I decided to build a solution – and that's how this project was born.
My Approach: Building a Modern Data Stack
- Data Generation: Python script to generate realistic synthetic financial transaction data.
- Database Setup: PostgreSQL (Docker) for raw data storage.
- Data Transformation: dbt to transform raw data into clean, analysis-ready models.
- Testing & Documentation: Data quality tests and lineage documentation.
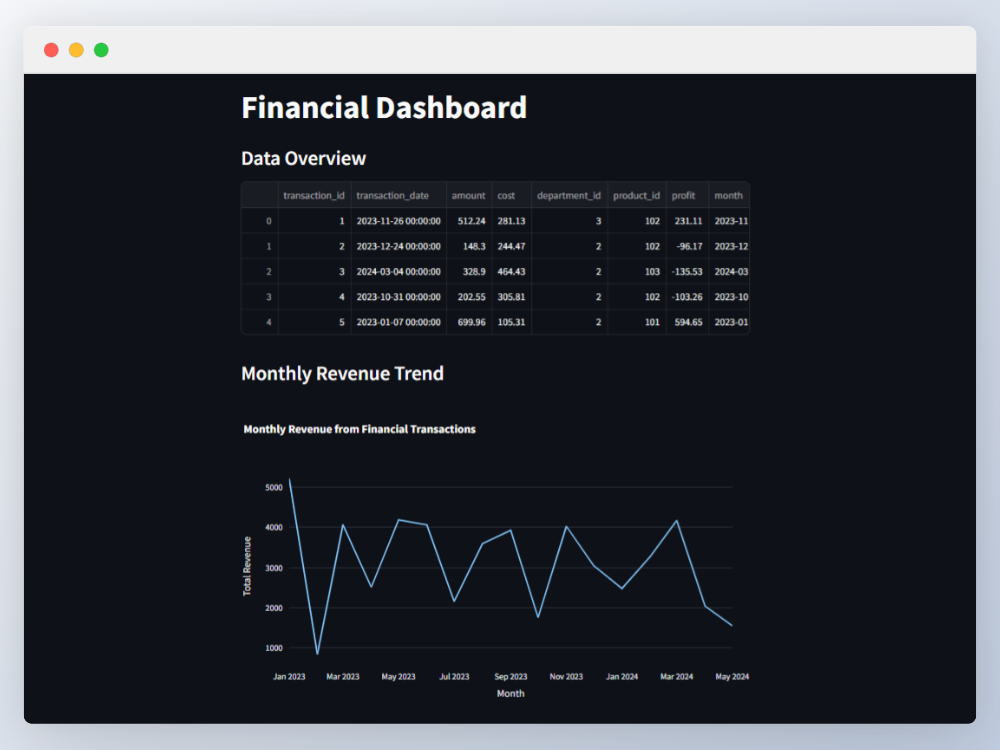
- Visualization: Streamlit and Plotly for interactive financial dashboards.
Key Technologies Used
Python | Pandas | SQLAlchemy | PostgreSQL | Docker | dbt | Streamlit | Plotly
View GitHub Repository →